Graphical User Interfaces (GUI)
Various programs are available that can read ORCA output files. Some programs that have proven specifically useful for ORCA output visualization are:
Warning
This tutorial was created using the Linux AppImage of Avogadro 2 Version 1.100.0! Please make sure, you are using the most recent version of Avogadro 2 to ensure compatibility!
ChimeraX (For ChimeraX, the SEQCROW plugin is very useful. It can be downloaded from the
Tools/More Toolsmenu.)Avogadro (ORCA enhanced version)
With these you can visualize your geometry, the charges, plot orbitals, spectra, etc.
Important
It might be necessary to include some extra printing for these programs (e.g., to generate orbital plots). In that case, the one way is to use the PRINTMOS and PRINTBASIS keywords on the simple input line:
!HF DEF2-SVP PRINTMOS PRINTBASIS
The corresponding print settings can also be controlled via the %output block:
%output
   print[p_mos] 1
   print[p_basis] 2
end
As Avogadro is the most commonly used and generally freely available option, we will further focus on the usage of Avogadro 2 as a GUI to ORCA. It can be used to set up your geometries and even analyze ORCA outputs, and the ORCA team has developed their own version that can be downloaded from the ORCA forum (may be used under Windows via Wine). However, that version is partly deprecated with ORCA 6!
Warning
Different versions of Avogadro may have partly limited compatibility to each other!
Avogadro 2 as a GUI
Drawing molecules
After opening Avogadro 2, you will see its main screen:
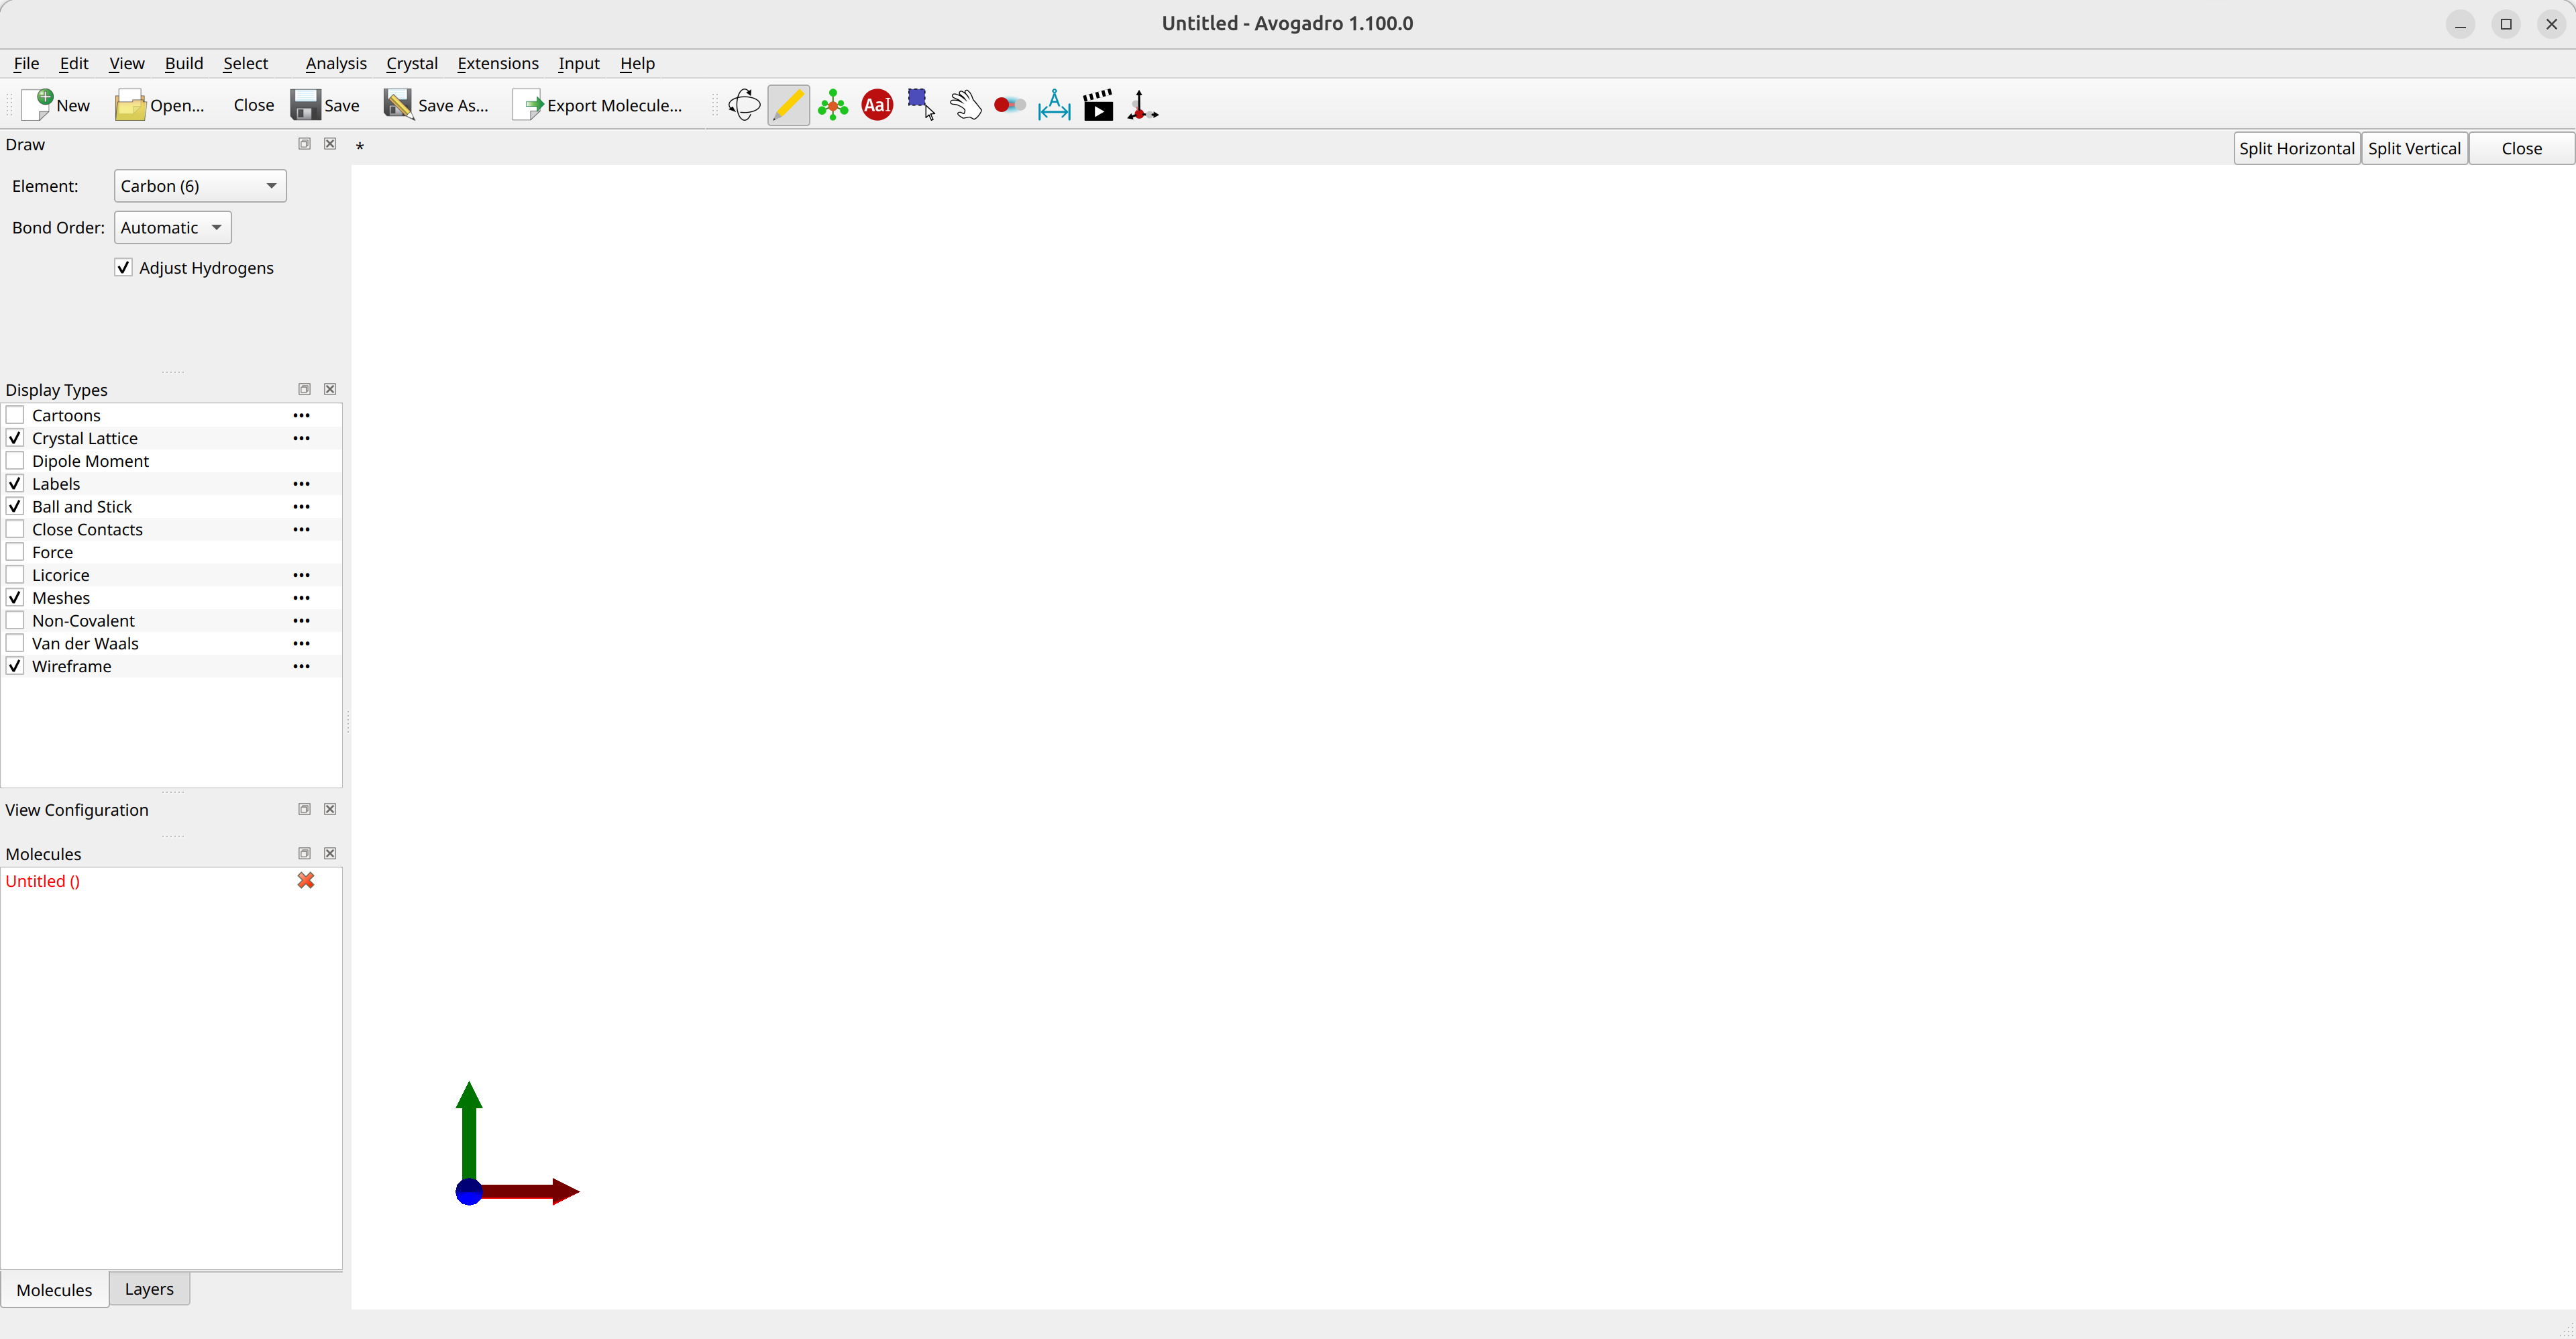
Figure: Avogadro 2's main screen.
Using the
Drawtool (yellow pencil symbol), you can draw you molecule using the left click to create and right click to delete atoms.The atom type is selected under
Elementand theAdjust hydrogenstick-option can automatically fix the valence of you molecule.The
Navigation Toolcan be used to rotate the molecule and theManipulation Tool(white hand symbol) eto move atoms.After drawing you guess structure, click on choose the
Extensions\(\rightarrow\)Open Babel\(\rightarrow\)Optimize Geometrydrop-down tool to run a simple molecular mechanics optimization.
Warning
The other optimization option in Avogadro 2 via Extensions\(\rightarrow\)Optimize Geometry is not functional at the moment! Please use the optimization via Open Babel as described above!
You can save you geometry as a .xyz via the Export Molecule... tool.
Creating inputs
After drawing a molecule, you can use Avogadro 2 to make simple ORCA inputs. Click on Input\(\rightarrow\)ORCA... and it will open
the ORCA Input Generator window:
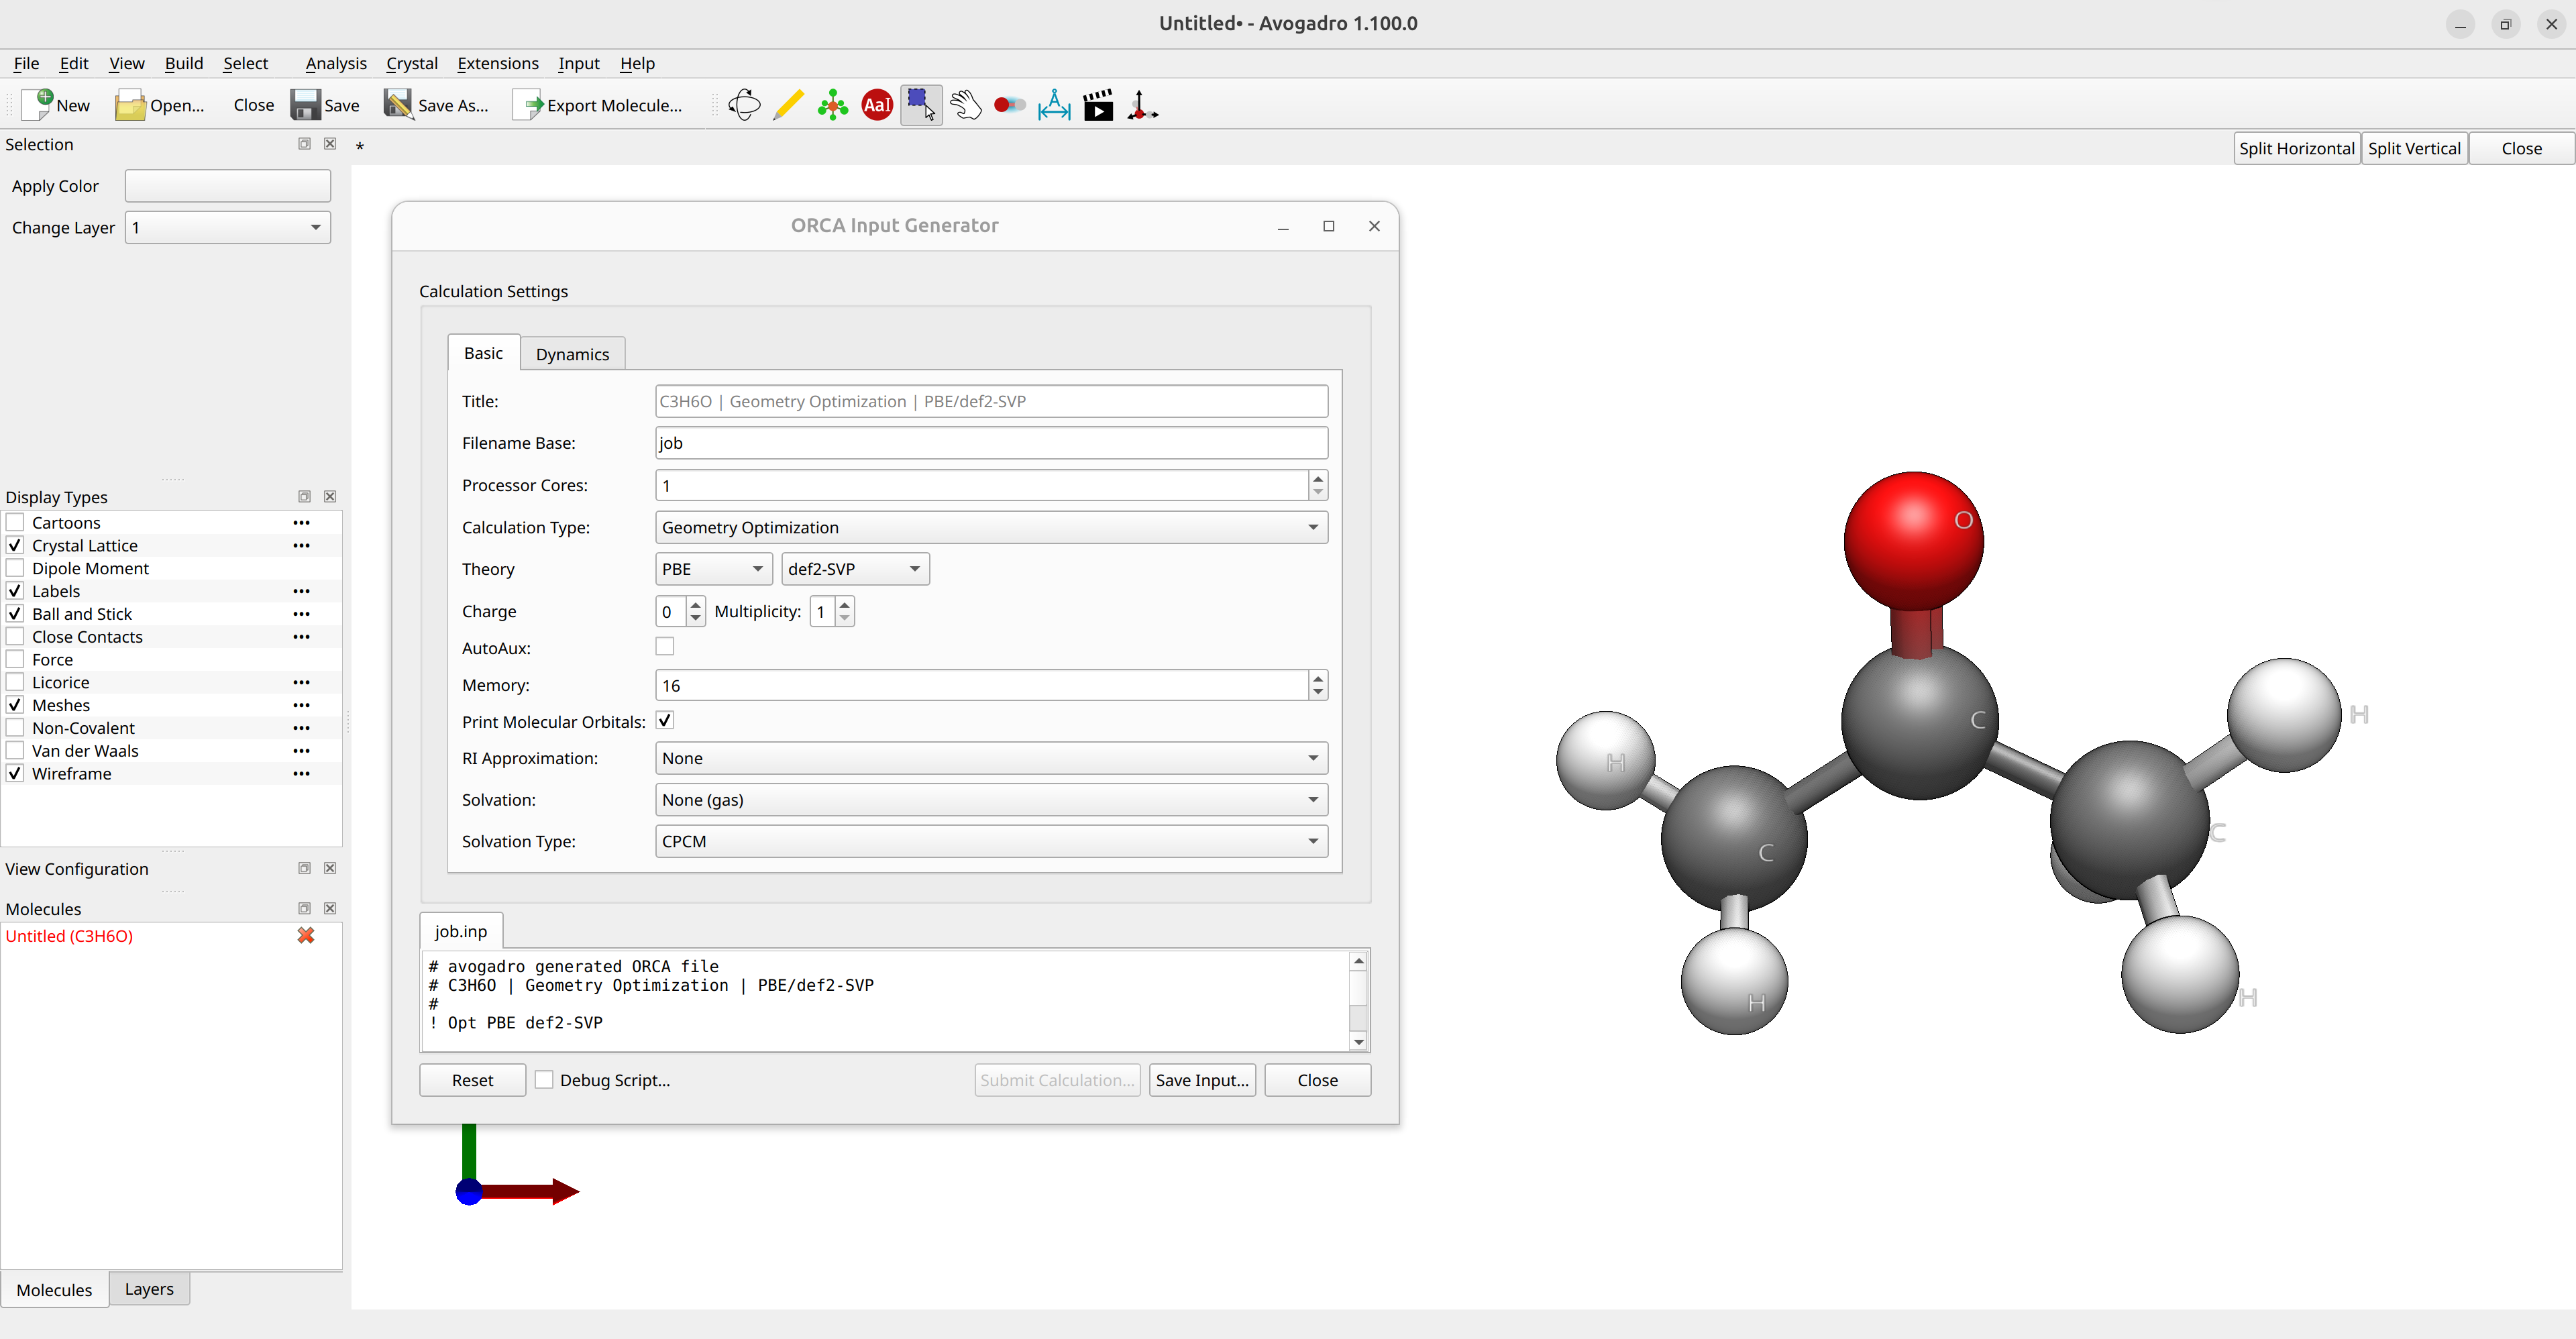
Figure: Creating ORCA inputs in Avogadro 2.
where you can choose the options you need and Save Input... the input. If you want to generate orbital plots, you should add check the Print Molecular Orbitals box.
Visualizing the Output
Orbital Plots
If you run a calculation using !PRINTMOS and !PRINTBASIS or the orbital printout options set by the ORCA input generator and saved your output into a file, you can visualize the orbitals by opening the basename.out file in Avogadro. Then select the orbital you want on the Molecular Orbitals panel to render, e.g. the HOMO of acetone:
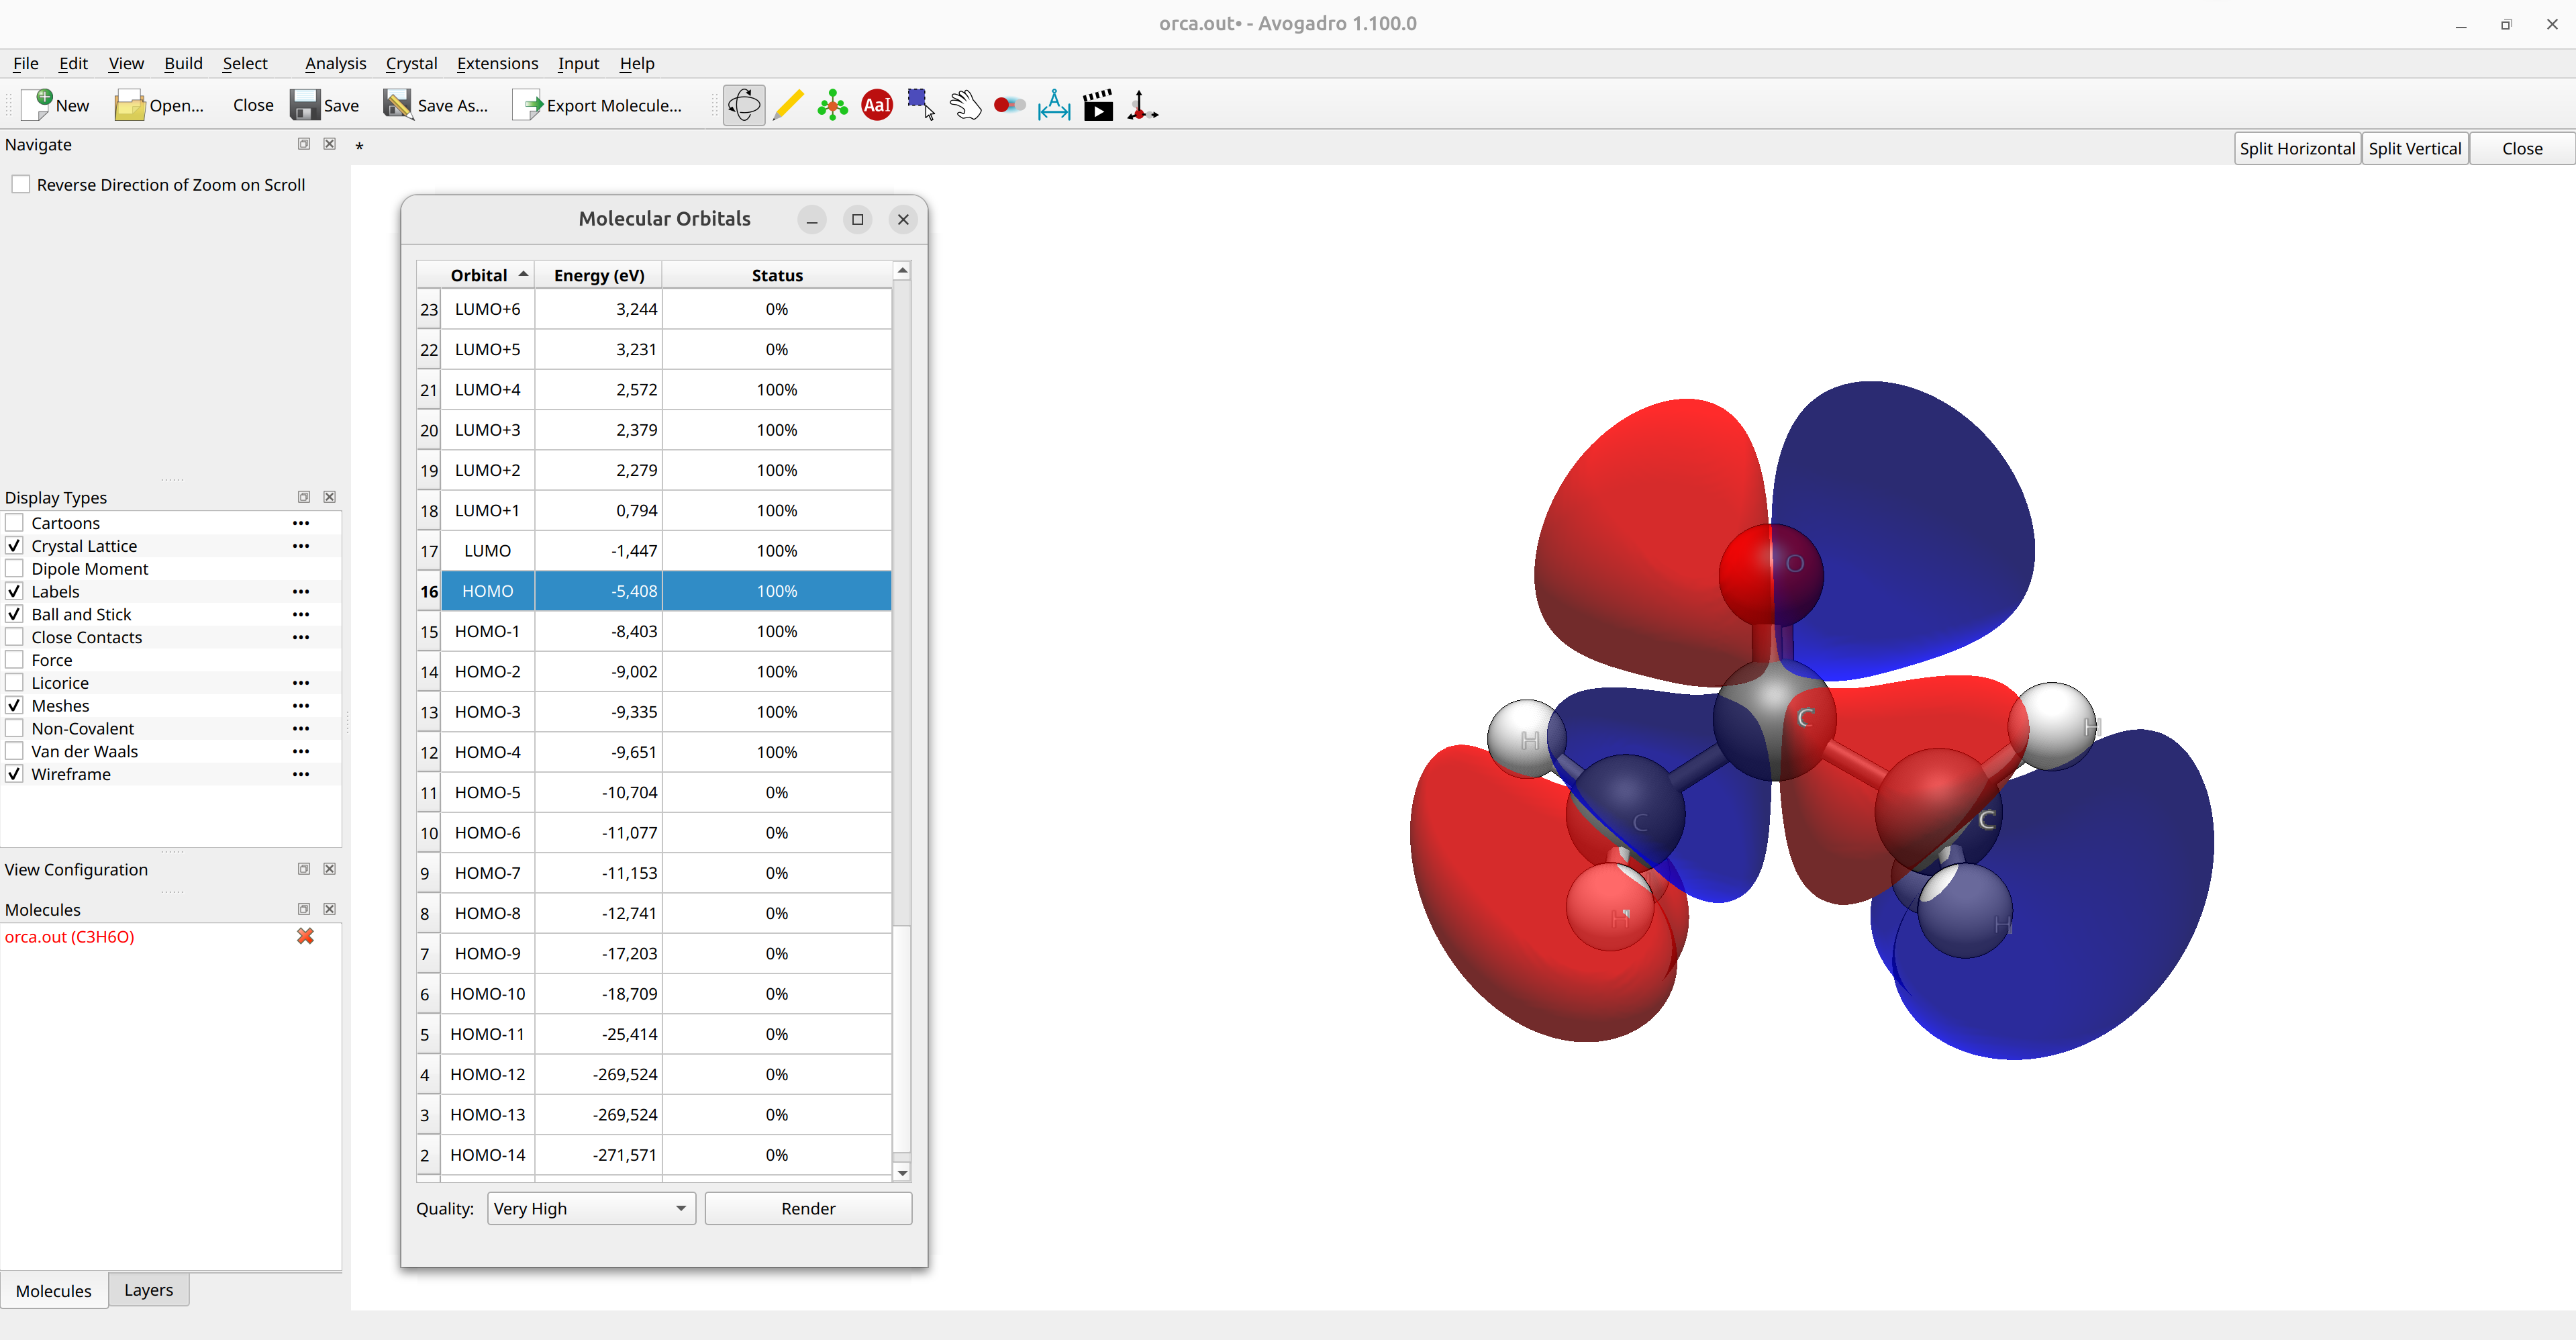
Figure: Molecular orbital plot in Avogadro 2.
Higher quality images can be generated by changing the Quality option at the bottom of the panel.
Hint
If the orbital image is not immediately available, click on Render to produce the image.
Density Plots
After loading an output file, you can also go to Analysis\(\rightarrow\)Create Surfaces.... A new panel will appear were you can select the Surface and Color by options to render the electrostatic potential (ESP) onto the electron density surface:
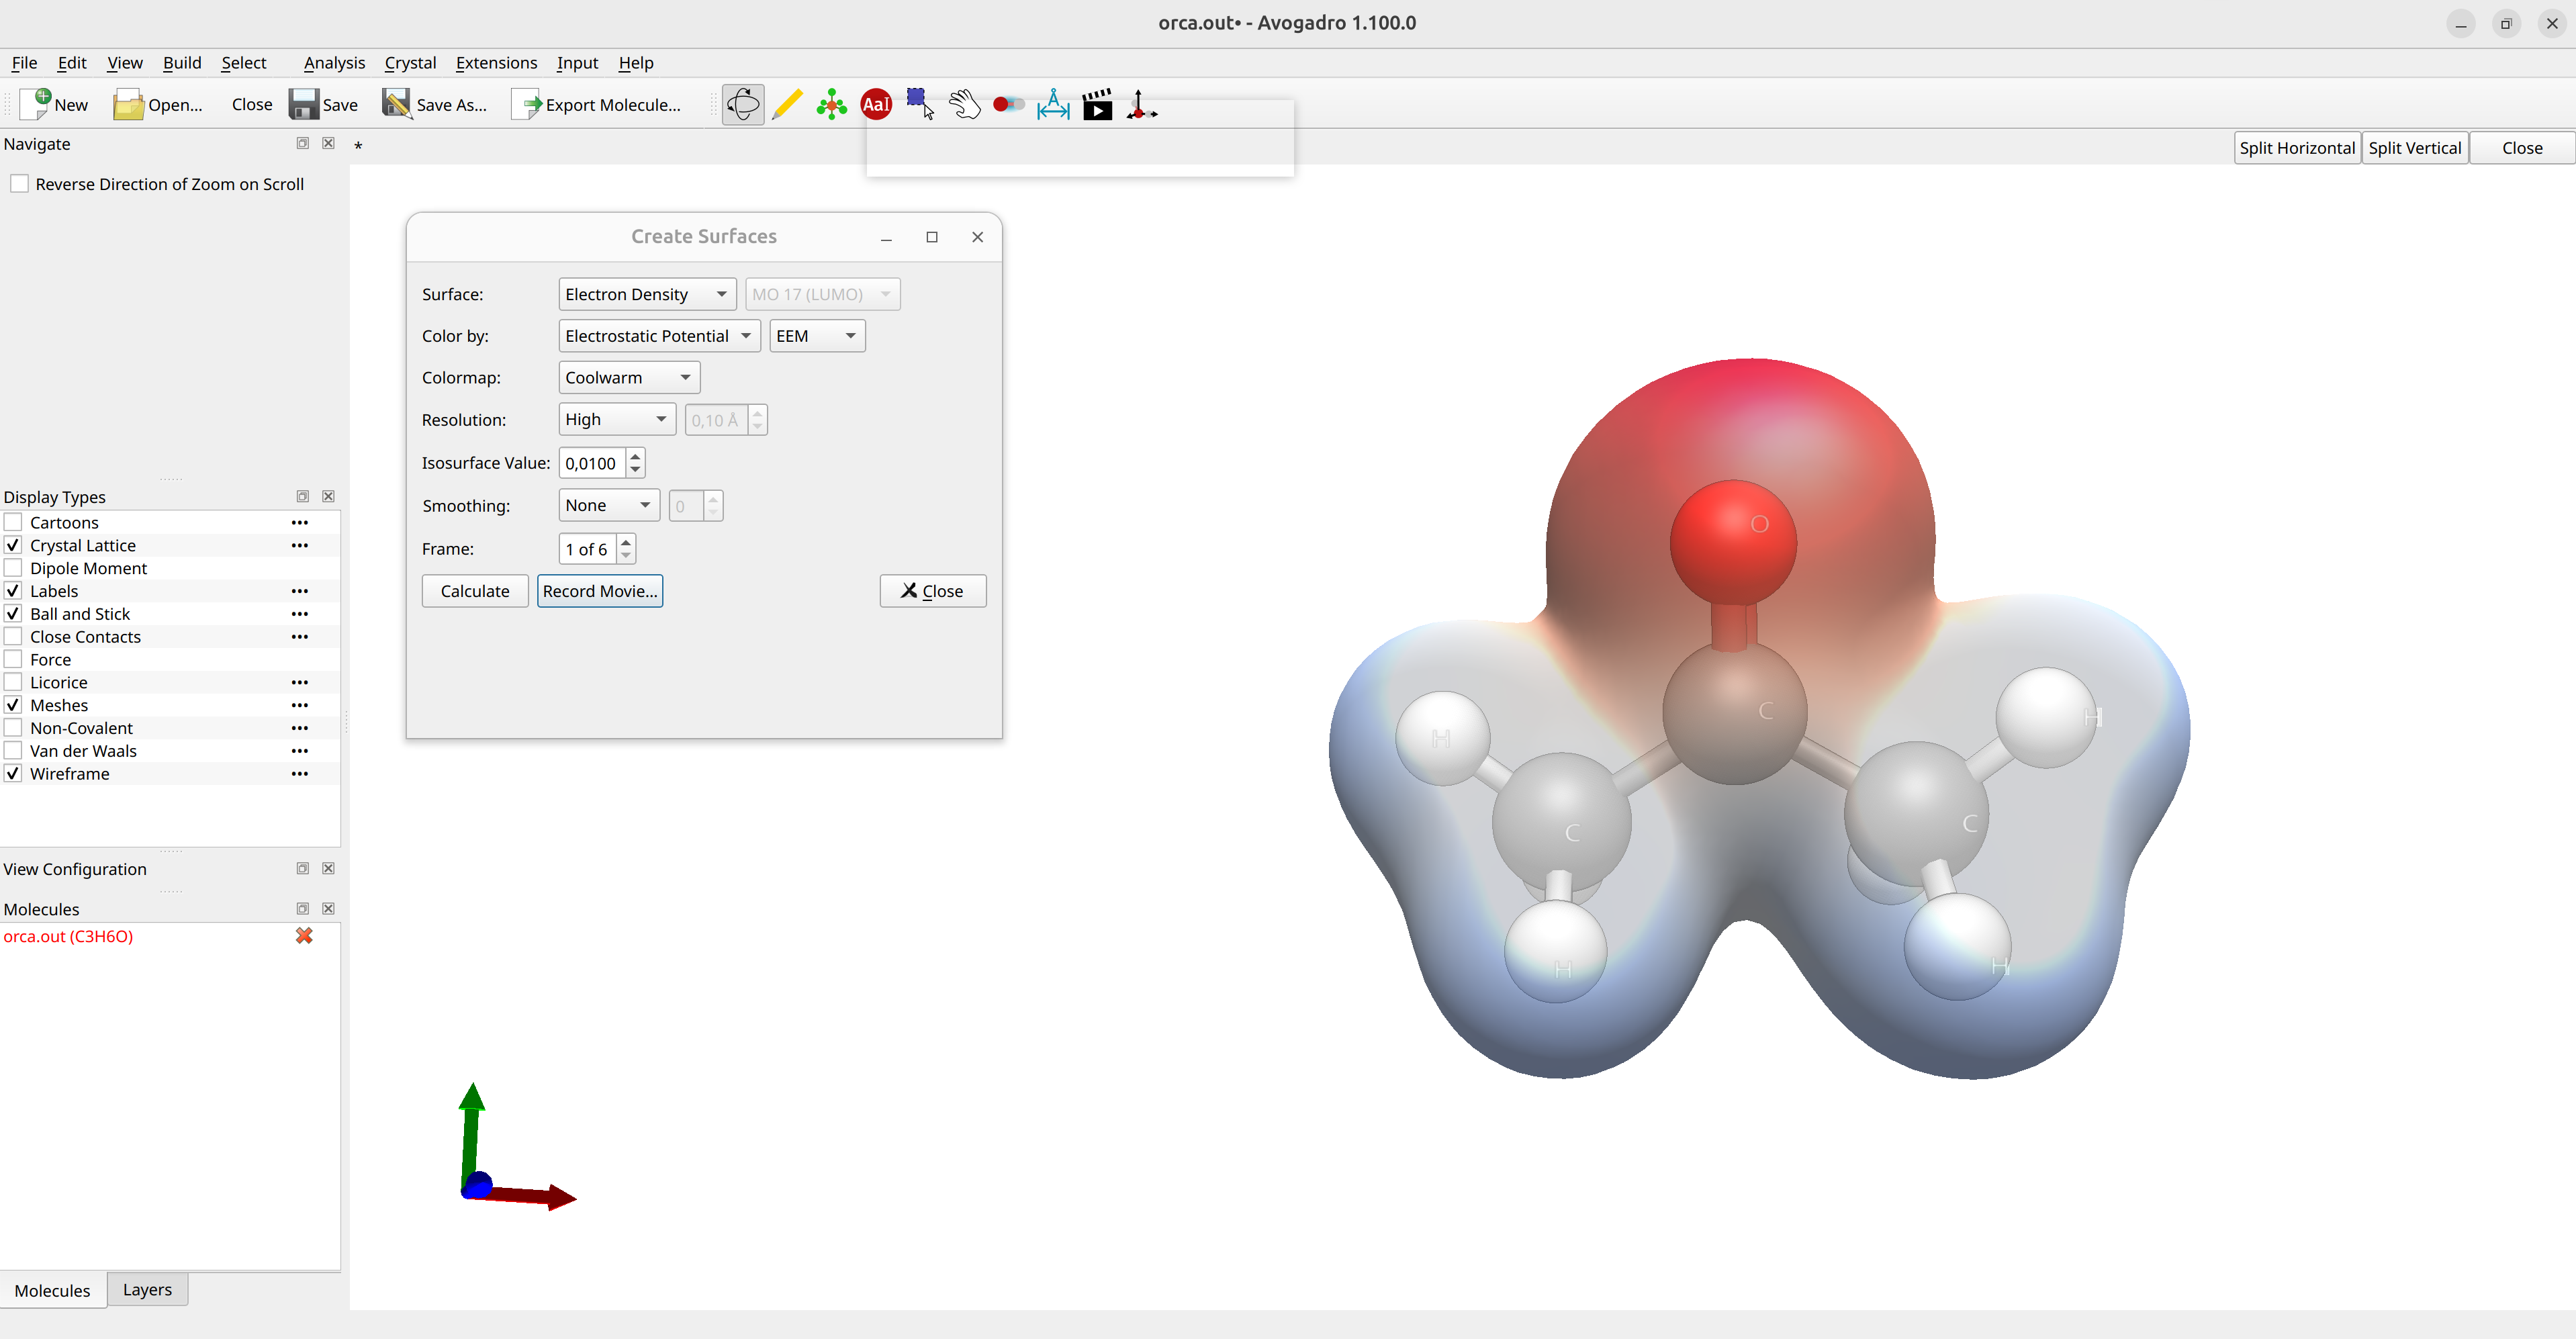
Figure: ESP plot in Avogadro 2.
Here blue means positive charge and red negative charge. You can also change the resolution of these surfaces at will.
Vibrational Modes and IR
In case your output has a frequency calculation on it (see Vibrational frequencies), e.g. by choosing the Calculation Type: Frequencies in the ORCA input generator of Avogadro 2 or by simply adding the FREQ keyword to the simple input line, the vibrational modes can be animated after loading the output file and the vibrational spectra can be plotted by selecting Analysis\(\rightarrow\)Vibrational Modes...:
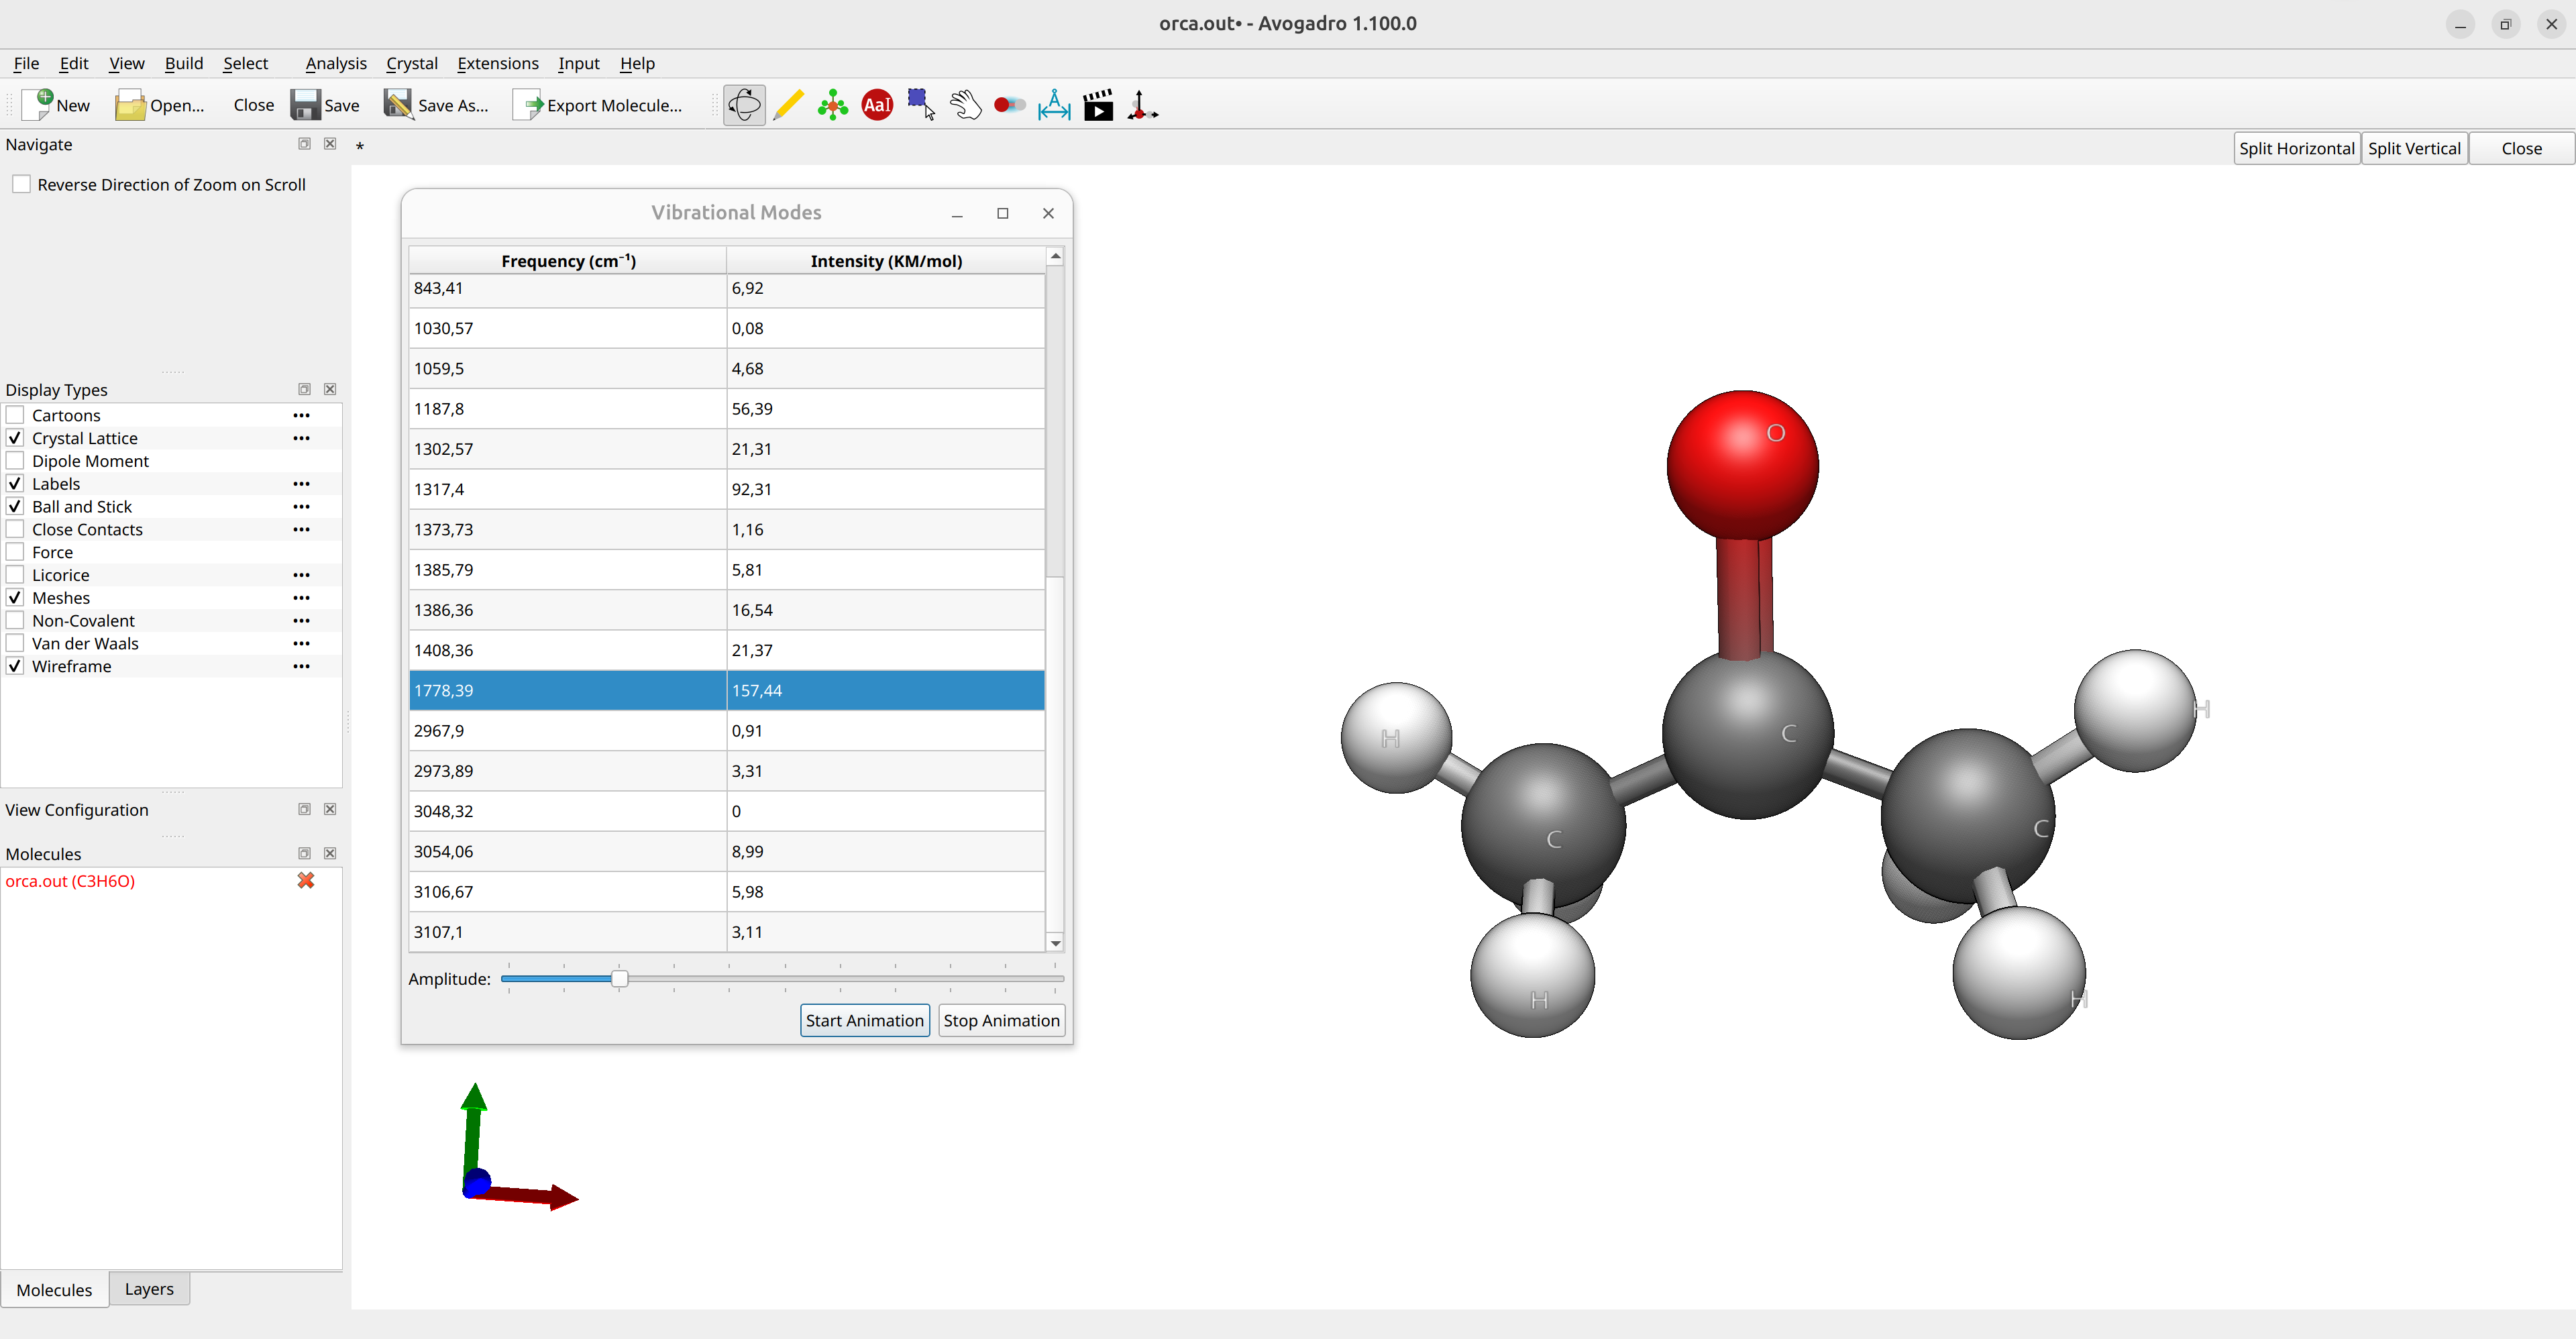
Animation: Vibrational modes of formaldehyde.